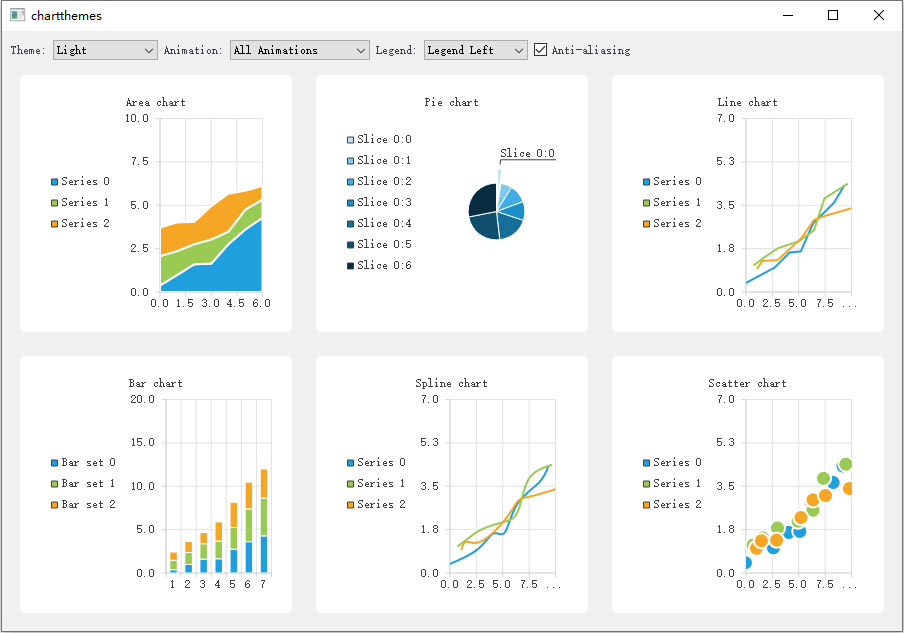
示例可以设置图表的系统内置主题。

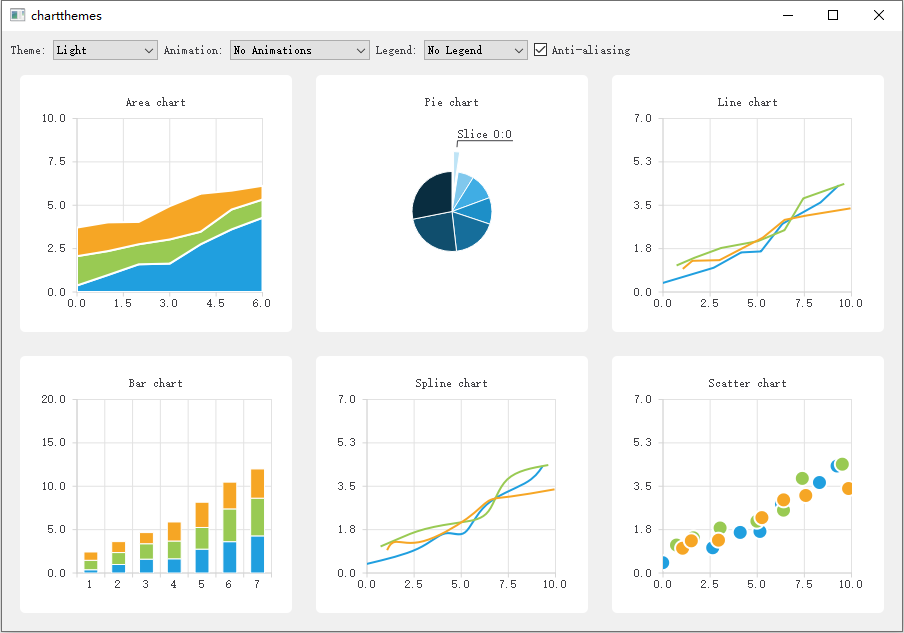
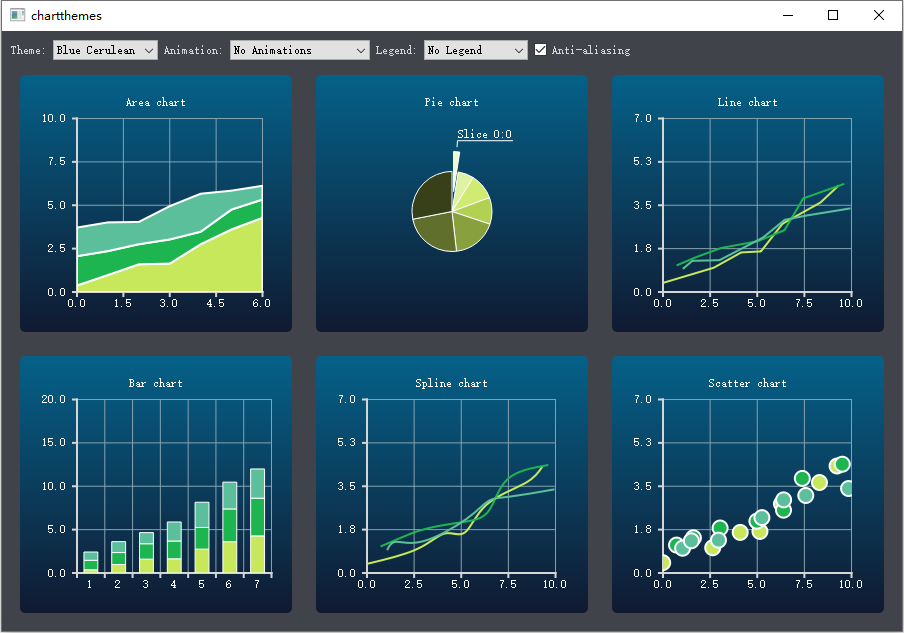
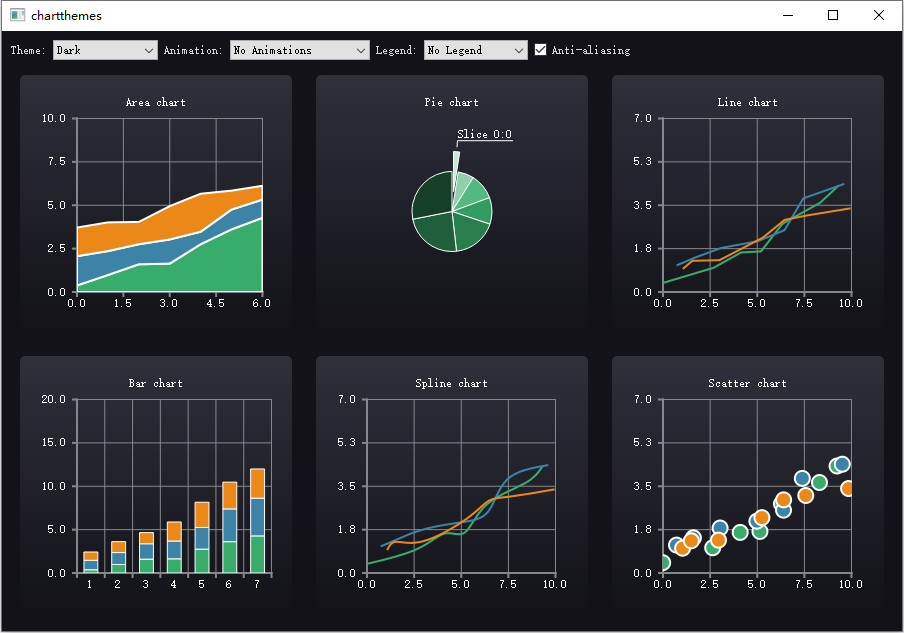
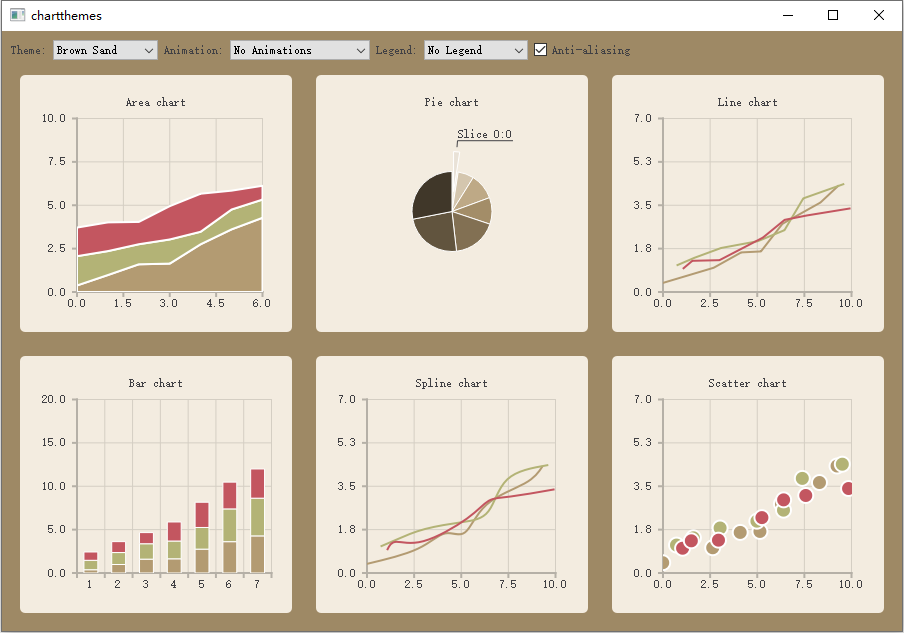
0x00 主题样式预览
- Light主题
- Blue Cerulean主题
- Dark主题
- Brow Sand主题
- Blue NCS主题
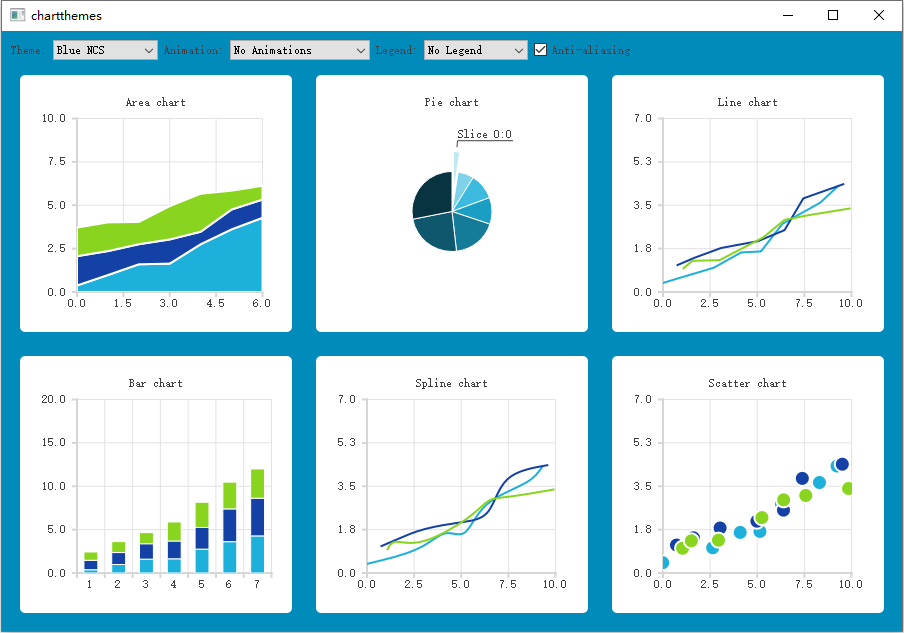
- High Contrast主题
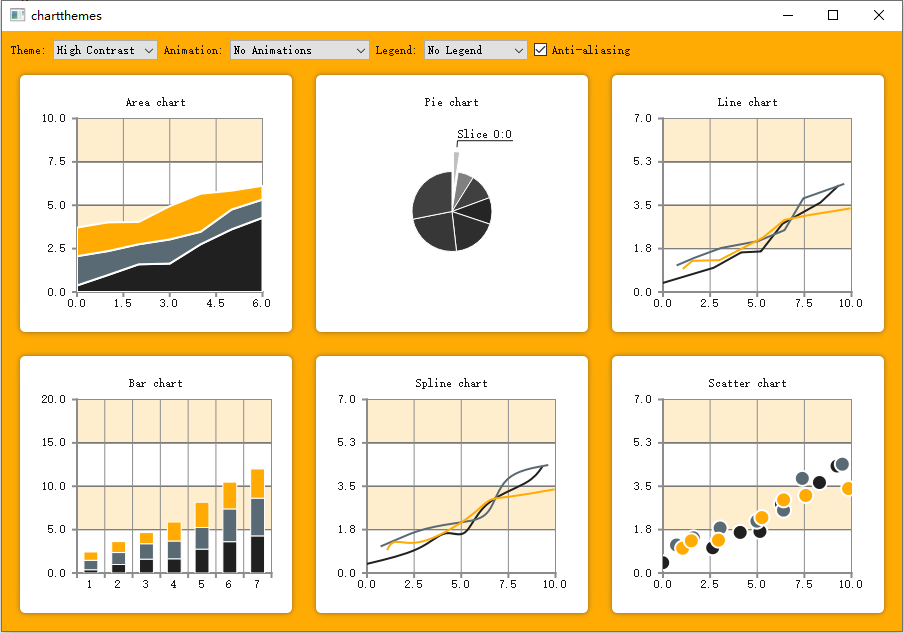
- Blue Icy主题
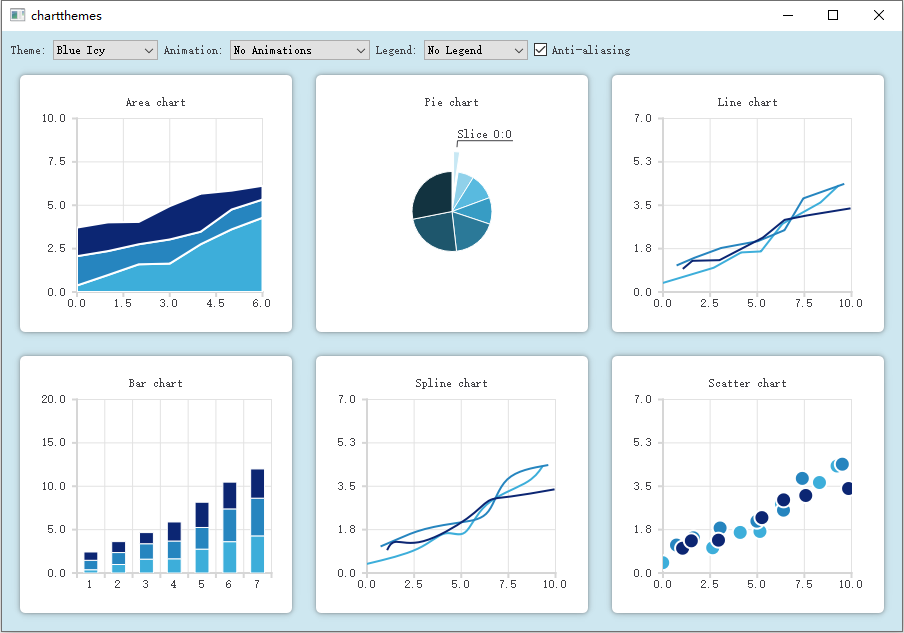
- Qt经典主题
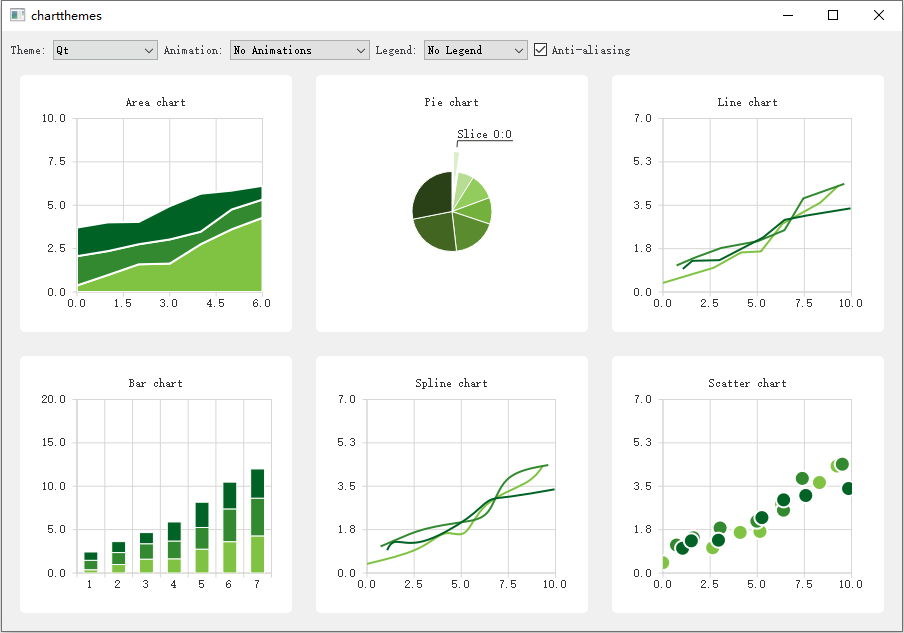
0x01 创建图表
以面积图为例。
需要创建QChart类作为面积图图表容器。
1
2
QChart *chart = new QChart();
chart->setTitle("Area chart");创建
QLineSeries与QAreaSeries实例装载数据。1
2
3
4
5
6
7
8
9
10
11
12
13
14
15
16
17for (int i(0); i < m_dataTable.count(); i++) {
QLineSeries *upperSeries = new QLineSeries(chart);
for (int j(0); j < m_dataTable[i].count(); j++) {
Data data = m_dataTable[i].at(j);
if (lowerSeries) {
const QVector<QPointF>& points = lowerSeries->pointsVector();
upperSeries->append(QPointF(j, points[i].y() + data.first.y()));
} else {
upperSeries->append(QPointF(j, data.first.y()));
}
}
QAreaSeries *area = new QAreaSeries(upperSeries, lowerSeries);
area->setName(name + QString::number(nameIndex));
nameIndex++;
chart->addSeries(area);
lowerSeries = upperSeries;
}设置默认坐标轴和坐标轴范围。
1
2
3
chart->createDefaultAxes();
chart->axes(Qt::Horizontal).first()->setRange(0, m_valueCount - 1);
chart->axes(Qt::Vertical).first()->setRange(0, m_valueMax);设置坐标轴的标签格式。
1
2
3
QValueAxis *axisY = qobject_cast<QValueAxis*>(chart->axes(Qt::Vertical).first());
Q_ASSERT(axisY);
axisY->setLabelFormat("%.1f ");
0x02 设置主题
用户可以可以选择系统中的内置主题。然后将此主题应用于布局中的所有图表。
配置组合框中的内置主题。
1
2
3
4
5
6
7
8
9
// add items to theme combobox
m_ui->themeComboBox->addItem("Light", QChart::ChartThemeLight);
m_ui->themeComboBox->addItem("Blue Cerulean", QChart::ChartThemeBlueCerulean);
m_ui->themeComboBox->addItem("Dark", QChart::ChartThemeDark);
m_ui->themeComboBox->addItem("Brown Sand", QChart::ChartThemeBrownSand);
m_ui->themeComboBox->addItem("Blue NCS", QChart::ChartThemeBlueNcs);
m_ui->themeComboBox->addItem("High Contrast", QChart::ChartThemeHighContrast);
m_ui->themeComboBox->addItem("Blue Icy", QChart::ChartThemeBlueIcy);
m_ui->themeComboBox->addItem("Qt", QChart::ChartThemeQt);设置组合框中的内置主题样式。
1
2
3
4
5
6
7
8
QChart::ChartTheme theme = static_cast<QChart::ChartTheme>(
m_ui->themeComboBox->itemData(m_ui->themeComboBox->currentIndex()).toInt());
//![6]
const auto charts = m_charts;
if (!m_charts.isEmpty() && m_charts.at(0)->chart()->theme() != theme) {
for (QChartView *chartView : charts) {
//![7]
chartView->chart()->setTheme(theme);
0x03 设置图表动画
可以设置每个图表上动画类型。
- 组合框动画类型:
- 没有动画;
- 网格轴动画;
- 系列动画;
- 或者两者都有。
1
2
3
4m_ui->animatedComboBox->addItem("No Animations", QChart::NoAnimation);
m_ui->animatedComboBox->addItem("GridAxis Animations", QChart::GridAxisAnimations);
m_ui->animatedComboBox->addItem("Series Animations", QChart::SeriesAnimations);
m_ui->animatedComboBox->addItem("All Animations", QChart::AllAnimations);
- 遍历设置全部图表动画。
1
2
3
4
5
6QChart::AnimationOptions options(
m_ui->animatedComboBox->itemData(m_ui->animatedComboBox->currentIndex()).toInt());
if (!m_charts.isEmpty() && m_charts.at(0)->chart()->animationOptions() != options) {
for (QChartView *chartView : charts)
chartView->chart()->setAnimationOptions(options);
}
0x04 设置图表额外信息
显示图表的额外信息在不同侧面。
可以设置不同侧面显示图表信息。
1
2
3
4
5m_ui->legendComboBox->addItem("No Legend ", 0);
m_ui->legendComboBox->addItem("Legend Top", Qt::AlignTop);
m_ui->legendComboBox->addItem("Legend Bottom", Qt::AlignBottom);
m_ui->legendComboBox->addItem("Legend Left", Qt::AlignLeft);
m_ui->legendComboBox->addItem("Legend Right", Qt::AlignRight);遍历设置全部图表的侧面显示。
1
2
3
4
5
6
7
8
9
10
11
12Qt::Alignment alignment(
m_ui->legendComboBox->itemData(m_ui->legendComboBox->currentIndex()).toInt());
if (!alignment) {
for (QChartView *chartView : charts)
chartView->chart()->legend()->hide();
} else {
for (QChartView *chartView : charts) {
chartView->chart()->legend()->setAlignment(alignment);
chartView->chart()->legend()->show();
}
}
0x05 图表抗锯齿
抗锯齿开启后会对性能造成影像但会改善显示效果。1
2
3bool checked = m_ui->antialiasCheckBox->isChecked();
for (QChartView *chart : charts)
chart->setRenderHint(QPainter::Antialiasing, checked);
0x06 关于更多
- 在QtCreator软件可以找到:
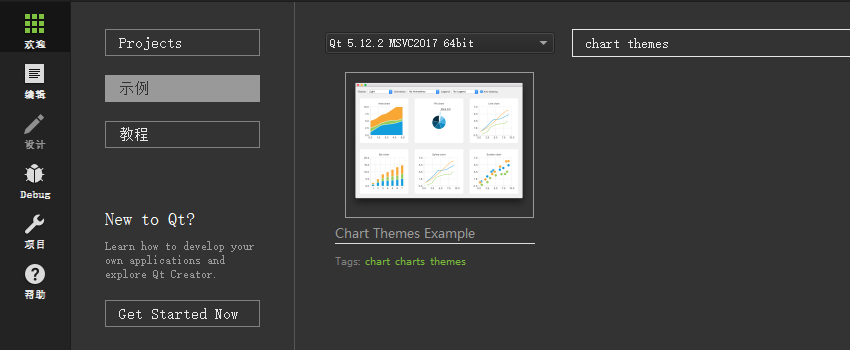
或在以下Qt安装目录找到
1
C:\Qt\{你的Qt版本}\Examples\{你的Qt版本}\charts\chartthemes
相关链接
1
https://doc.qt.io/qt-5/qtcharts-chartthemes-example.html
Qt君公众号回复『Qt示例』获取更多内容。